
Update — 13 September 2026. The snapshot below was measured on 1 August 2026 and is kept as a dated record. Here is where the same measurements stand today:
- The catalogue is now 1,461 public services, and 1,137 of them (78%) publish a delivery measurement — 1,072 as an average completion time and 65 as a throughput rate such as "298 per minute". Drop rates are published for 39 services, median 20%.
- The August snapshot covered 553 services, 454 of them with a measured completion time, and its median was 48.5 minutes. Today the duration pool is 1,079 services and its median is 1 hour 54 minutes. Those two medians describe different catalogues rather than the same services measured twice — more than 900 services have been added since August, many of them country-targeted, refill-backed or otherwise slower lines. We publish both figures rather than the flattering one, and we do not present the difference as a trend. The split between services reporting a duration and services reporting a rate also moves as suppliers change what they publish, so the size of the duration pool is not stable from month to month.
For current per-service figures, see the live catalogue, the fastest services ranking or the dataset files linked below, which are regenerated daily.
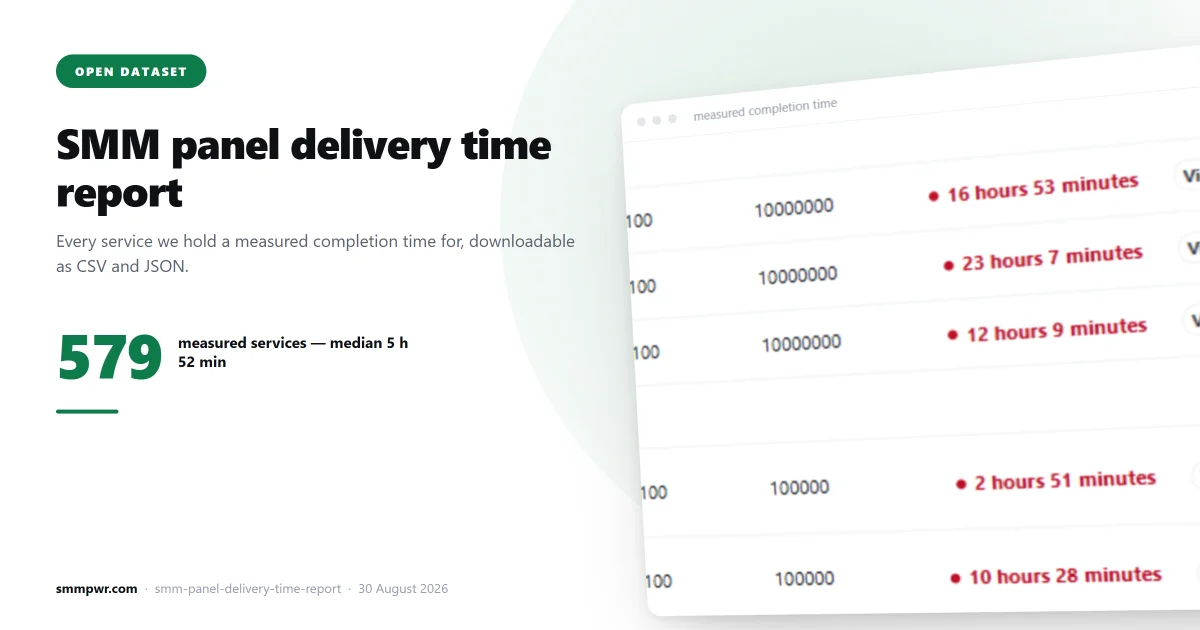
Most SMM panels answer "how fast is this service?" with a promise. This page answers it with measurements. Below is the 1 August 2026 snapshot of the delivery statistics behind every public service on SMM PWR — 553 services, 454 of them with a measured average completion time — together with the full dataset as CSV and JSON, free to reuse and cite.
Key findings — 1 August 2026
- 454 of 553 public services (82%) carry a measured average completion time. The rest have no published measurement — we leave those cells empty rather than invent a number.
- The median measured completion time is 48.5 minutes.
- 44% of measured services finish within 30 minutes; 19% finish within 5 minutes; 22 services complete in under a minute.
- Of the 34 services whose supplier publishes a measured drop rate, the median drop is 3%, and 59% stay at or under 5%.
- About 260 services now also display a conservative capacity badge on the services page — "Day 10-15K" where the supplier publishes daily capacity, "Hour 1-2K" where it publishes an hourly rate. We keep the supplier's own unit instead of converting, because an hourly rate multiplied to a daily figure overpromises.
How long an order really takes
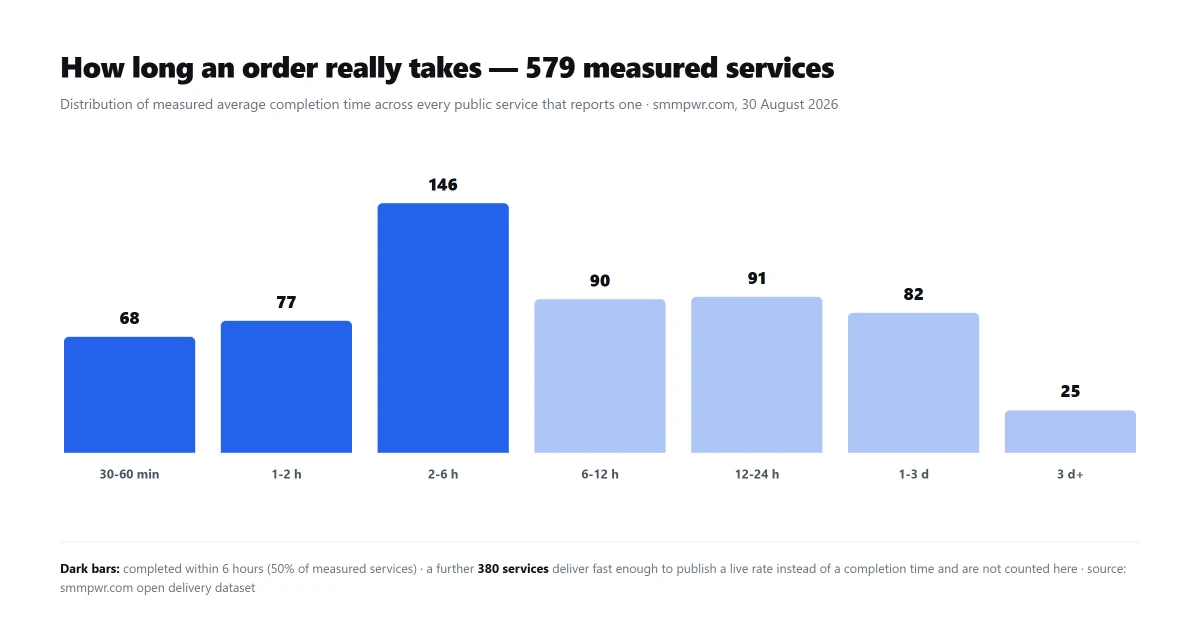
The distribution has two clear clusters. Engagement-style services (likes, views, saves) concentrate on the left: minutes, not hours. Follower and subscriber services, and anything the supplier delivers with gradual drip-feed, form the right-hand cluster of 1–6 hours and beyond. A single "average delivery" number for a whole panel would hide exactly this split — which is why we publish the figure per service.
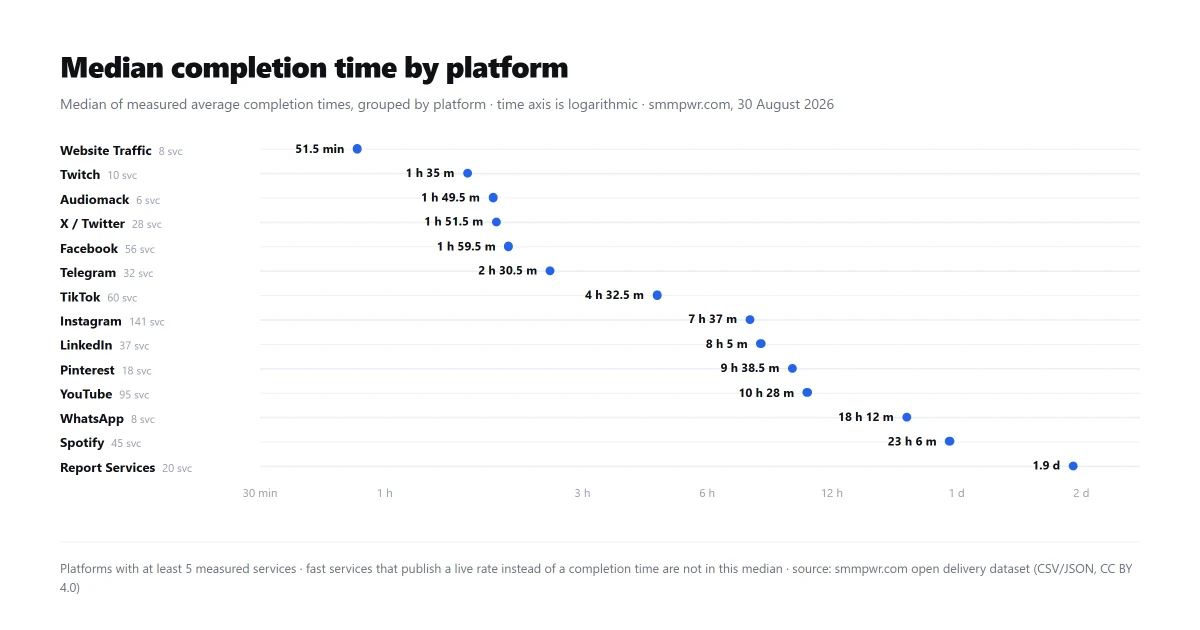
Median completion time by platform
| Platform | Services | Measured median |
|---|---|---|
| Website Traffic | 23 | 9 min |
| 164 | 10.5 min | |
| Telegram | 97 | 41 min |
| X / Twitter | 57 | 44 min |
| 37 | 1 h 4 min | |
| Kick | 8 | 1 h 40 min |
| 6 | 3 h 48 min | |
| Threads | 15 | 14 h |
| YouTube | 75 | 15 h |
| TikTok | 37 | 24 h |
Two notes before you compare platforms. First, the mix of service types differs: our Instagram catalogue is heavy on fast engagement services, while the YouTube and TikTok catalogues include many drip-fed view and watch-time packages that are slow by design. Second, small samples (Kick with 8 services, LinkedIn with 6) move a lot when a single service changes.
Drop rates, where they are measured
Drop rate — how much of a delivered quantity disappears afterwards — is the least-published number in this industry. Only 34 of our services currently have a supplier-measured drop figure. Among those, the median is 3%, 59% stay at or under 5%, and the worst measured services lose about half of what they deliver — which is exactly why we print the number next to the service instead of hiding it. Where there is no measured figure, we show nothing: an unmeasured service is not a 0%-drop service.
Methodology
Everything on this page comes from one pipeline, and none of it is estimated:
- Our monitoring server polls the upstream suppliers' own published per-service statistics every 5 minutes and republishes them on the services page unchanged.
- Where a supplier publishes hourly completion counts instead of an average time, the average is computed with Little's law (average work-in-progress divided by completion rate) — a measurement, not a guess.
- Staleness rules: a value older than 6 hours, or based on fewer than 24 completions in the last 24 hours, is dropped from display rather than shown as if it were fresh.
- Capacity ranges are derived from the figures suppliers publish, always rounded down to a conservative range and always kept in the supplier's own unit (per day or per hour) — hourly rates are never multiplied into daily claims.
- A missing value means the supplier publishes nothing for that service. We never fill gaps with invented numbers.
Download the dataset
The full per-service table behind this report — service name, platform, measured average completion time, drop rate and published capacity — is free to download:
- smmpwr-delivery-data.csv (spreadsheet-friendly)
- smmpwr-delivery-data.json (with methodology metadata)
License: CC BY 4.0 — use it in articles, comparisons or research, commercial or not, as long as you link back to this page or to smmpwr.com.
How to cite this data
Delivery statistics from SMM PWR's measured-data report (1 August 2026 snapshot): across 454 measured SMM panel services the median completion time was 48.5 minutes, with 44% of services completing within 30 minutes. Source: smmpwr.com/blog/smm-panel-delivery-time-report
Journalists and bloggers: the charts on this page may be republished with attribution. If you need a different cut of the data (a platform, a service type, a time window), message us on Telegram @SMM_PWR or WhatsApp +995 595 709 861 and we will pull it from the raw measurements.
This report is refreshed with each significant catalogue change; the live per-service figures on the services page update every few minutes around the clock.
Related services
What this article describes, on the price list:
- Instagram Likes — 171 services from $0.0051 per 1000
- YouTube Views — 48 services from $0.50 per 1000
- TikTok Views — 22 services from $0.06 per 1000
- Instagram Views — 19 services from $0.0012 per 1000
- Instagram SMM panel — the whole catalogue for that platform