
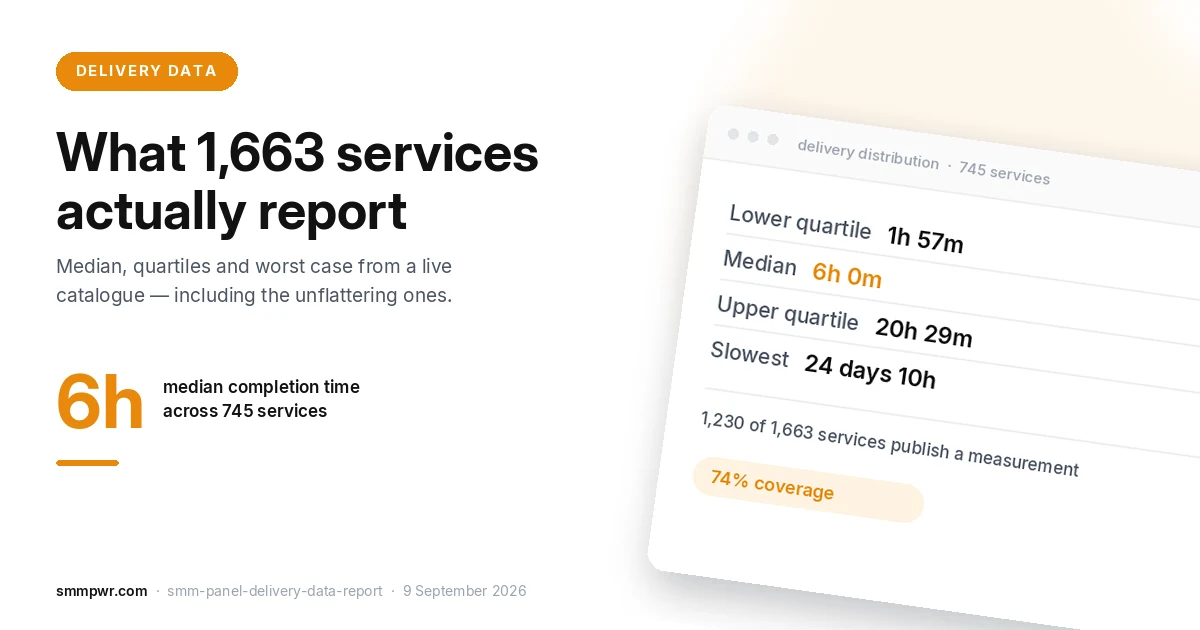
Direct answer: Across our own price list of 1,473 services on 11 September 2026, 1,139 (77%) publish a delivery measurement taken from the supplier behind them. The median service that reports a completion time finishes in 6 hours 16 minutes. A quarter finish inside 2 hours 5 minutes; a quarter take longer than 20 hours 58 minutes. The slowest in the catalogue is 24 days 10 hours.
This is a snapshot of real numbers from a working panel, published because almost nobody in this industry publishes any. Panels advertise "instant delivery" and "0% drop" as slogans. Below are the figures our catalogue actually reports, including the unflattering ones.
How many services report anything at all
Of 1,473 services on the price list, 1,139 publish a delivery measurement and 334 do not. That is 77% coverage, and the missing quarter is the honest part: when the supplier behind a service stops reporting, the field reads "No data from server" instead of an estimate we invented.
| What the service publishes | Services | Share |
|---|---|---|
| Average completion time (e.g. "6 hours 16 minutes") | 704 | 48% |
| Throughput rate (e.g. "1,029 per hour") | 435 | 29% |
| No data from the supplier | 334 | 23% |
The two measurement types are not interchangeable. A completion time answers "when will my order be done". A throughput rate answers "how fast is this supplier moving right now". Suppliers publish one or the other, so we pass through whichever we are given rather than converting one into the other and losing the distinction.
What the delivery times actually look like
Taking the 704 services that report a completion time, the distribution is wide enough that any single "average delivery" claim would be meaningless:
| Percentile | Completion time |
|---|---|
| Fastest service | 31 minutes |
| Lower quartile (25%) | 2 hours 5 minutes |
| Median (50%) | 6 hours 16 minutes |
| Upper quartile (75%) | 20 hours 58 minutes |
| 90th percentile | 2 days 15 hours |
| Slowest service | 24 days 10 hours |
The gap between the lower quartile and the 90th percentile is roughly 30x. That is the single most useful thing on this page: a panel that tells you its "average delivery time" is compressing a 30-fold spread into one number. Ask for the figure on the specific service you are buying, not the panel average.
Drop rates: 39 services publish one
Drop rate is where the industry is quietest. Only 39 of our 1,473 services carry a drop figure, because only some suppliers publish one. We show the supplier's own number rather than a marketing claim, which is why several are ranges rather than single values and why some of them are bad.
| Reported drop | Services |
|---|---|
| 0% | 1 |
| 3% | 2 |
| 4% | 7 |
| 5% | 2 |
| 11% | 1 |
| 10–20% | 3 |
| 18% | 1 |
| 19% | 1 |
| 21% | 2 |
| 15–30% | 5 |
| 20–30% | 6 |
| 27% | 2 |
| 50–80% | 1 |
| 80–100% | 5 |
Five services report an 80–100% drop. We still list them, with that number visible, because the supplier still sells them and some buyers want the cheapest possible count regardless of retention. Hiding the figure would sell the same service without the warning.
Why so few panels publish this
Two reasons, and only one of them is technical.
The technical reason: most panels are resellers of resellers. If you buy from an upstream panel that does not report delivery data, you have nothing to publish. You can time your own orders, but with a few orders per service the sample is too small to mean anything.
The commercial reason: published numbers can be checked. "Instant delivery" cannot be wrong because it does not say anything measurable. "6 hours median, 24 days worst case" can be held against you. That is exactly why it is worth more to the buyer.
How to check any panel's claims yourself
- Ask for the figure on one specific service, not the panel average. If the answer changes to a slogan, that service has no data behind it.
- Check whether the number moves. A delivery figure that is identical this week and next week is a fixed label, not a measurement.
- Look for the ugly numbers. A catalogue where every service reports 0–2% drop and "instant" delivery is a catalogue of claims, not measurements. Real data has a long tail.
- Place one small order and time it. The minimum on most services here is 10 units or fewer, so this costs cents.
Methodology
Every figure above comes from the same public dataset that drives our price list, read on 11 September 2026. Percentiles are computed over the 704 services reporting a completion time; services reporting a throughput rate are counted separately because the two are not the same measurement. Nothing is estimated, smoothed or filled in: services with no supplier data are counted as having no data. The catalogue changes daily, so the numbers on this page are a dated snapshot rather than a standing claim — the current values are always on the price list itself, next to each service.